Plotting with personal palettes for color ggplot2 - inspired by emwCols()
scale_color_emw_c.RdPlotting with personal palettes for color ggplot2 - inspired by emwCols()
Arguments
- name
Name of Palette. Run
names(emwColsPalettes)to view options.- direction
Sets order of colors. Default palette is 1. If direction is -1, palette color order is reversed
- legend_title
Character string specifying legend title. Default
NULL.- ...
Other arguments passed on to
scale_color_gradientn
Examples
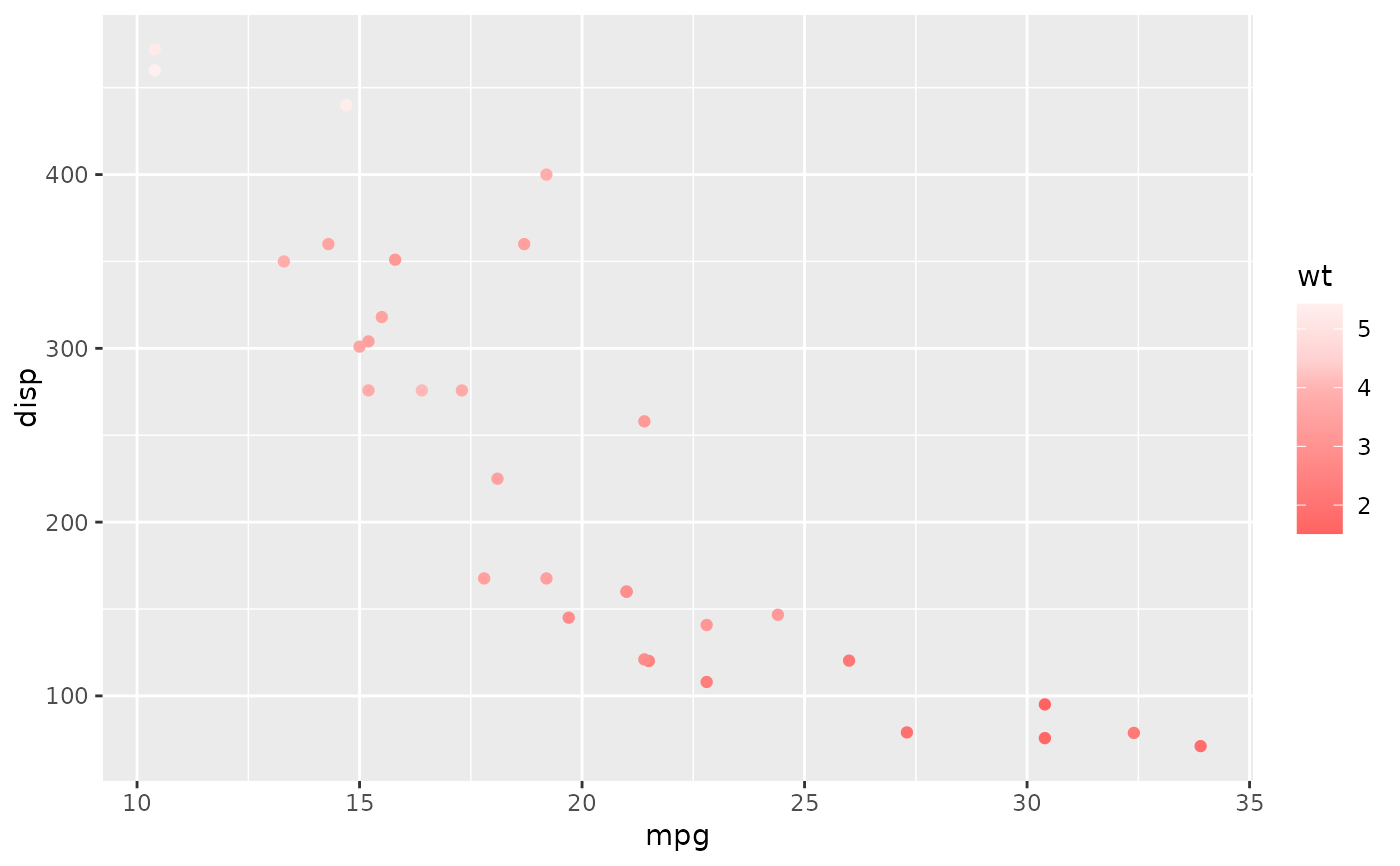
library(ggplot2)
ggplot(data=mtcars, aes(x=mpg, y=disp, color=wt)) +
  geom_point() +
  scale_color_emw_c("Corals")